Both the UBC Millwright Safety tool and OSHA’s Safety Pays Program produce reports that allow companies to compare their workplace injury rates to those of their peers.
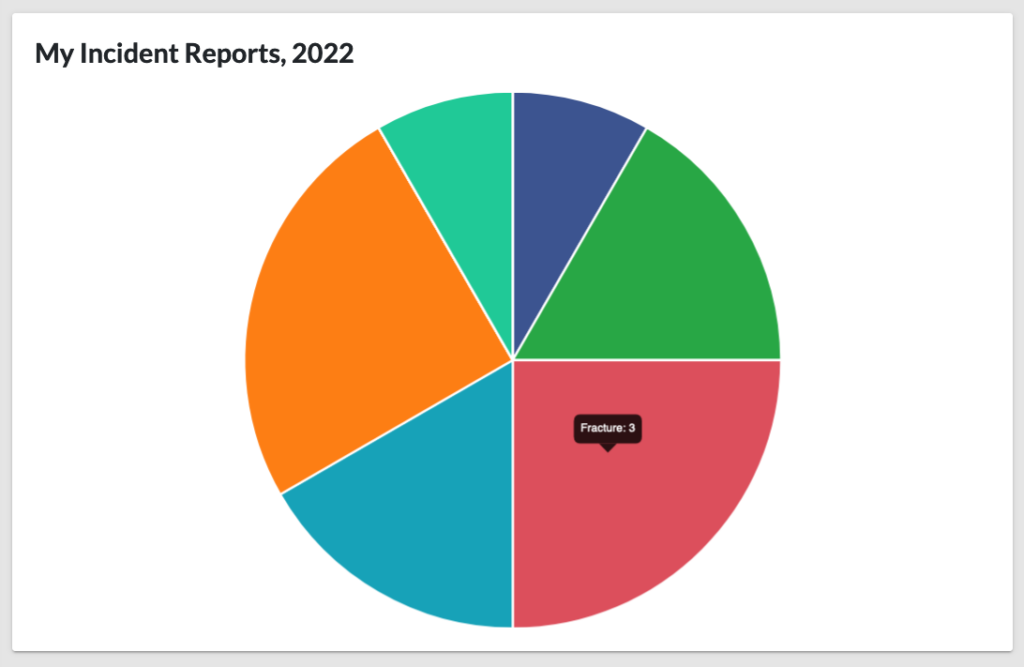
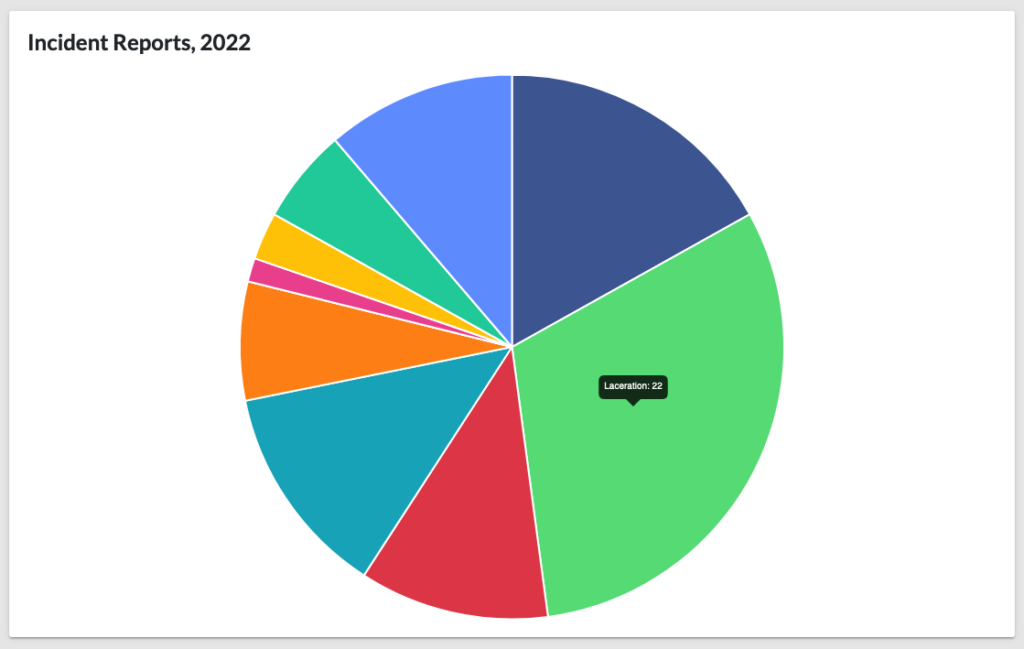
You can sign up for a UBC Millwright Safety account and input your safety data quarterly – a process that takes most contractors about five minutes. Then you’ll see info-graphics showing your company’s injury types, incidence rate, time of day injuries occur, rates of first aid being rendered and employees not being fit for duty, incidents by region, and work hours compared to an average of stats for all other UBC contractors using the system.
We share the overall numbers with our training departments so that if they see a trend, they can modify training to address it, says Mark Benacquisto, executive director of the UBC’s Milwright/Pile Driver First Trust. If lacerations are common, for instance, training directors can reach out to contractors to find out whether there are mindset issues, tool issues, etc. behind the injuries and then tweak training accordingly.
At least one contractor has received a discount on workers’-comp insurance by showing they are tracking data through the UBC Millwright Safety platform. “It’s an easy platform,” Benacquisto says. “It’s simple to use. It’s secure. If you want us to change safety, we need the data to do it.”
OSHA’s Safety Pays program similarly allows contractors to input data and see how their stats stack up against peers in the same industry. The program also can help you estimate the immediate and long-term financial impact that worker injuries have in lost profits and increased workers’ compensation insurance premiums.
Click the image below to learn more about the Safety Pays Program.